
Problem Statement
Empower global sustainability practices through the transparency of publicly available online data.
Insight
How would we get companies to improve on their sustainability by leveraging on publicly available data? This is a question that is worth answering in order to fast-track development and a move towards a greener, more sustainable future. Companies have a hard time analyzing other companies sustainability reports. This is due to the fact that the reports are quite large which requires plenty of man-power and time to analyze effectively. If we can get a way to quickly analyze and present the findings from the reports, companies can quickly get the data of their competitors and offer their customers more sustainable products thus pushing the sustainability mark.
The Solution
To solve this problem, we use an application that allows users to upload sustainability reports. The report is then sent to a central server where it is process to extract the relevant data from the report. Extra processing is done on the data to derive insights and package the data in a more user friendly format. These results are then sent back to the user and rendered on the webpage.
If companies can easily get data concerning other companies they can aim to supersede those other companies. This in turn would work in the reverse and thus you would have a positive feedback loop. This would lead to a more sustainable future where companies’ interest in profit leads them to ensure they provide more sustainable products through more sustainable processes.
Features
- Automatic and fast extraction of data.
- Automatic analysis of data.
- Automatic visualization of data.
- Chat with an LLM(Large Language Model) to refine the results.

Figure 1: Features of the application
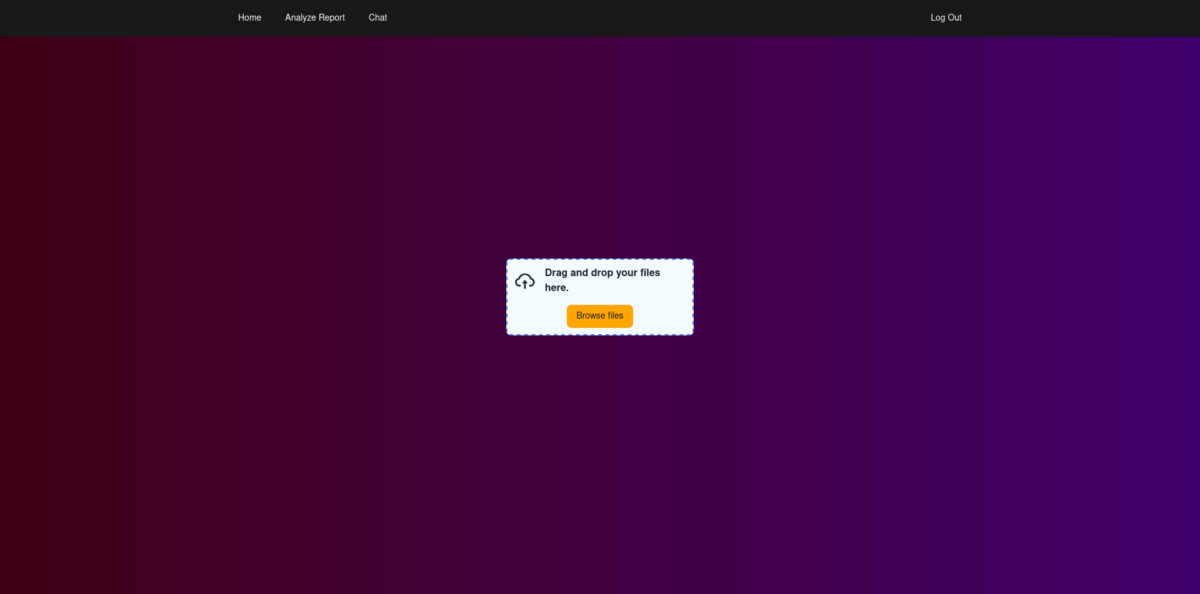
Figure 2: Upload section of the application
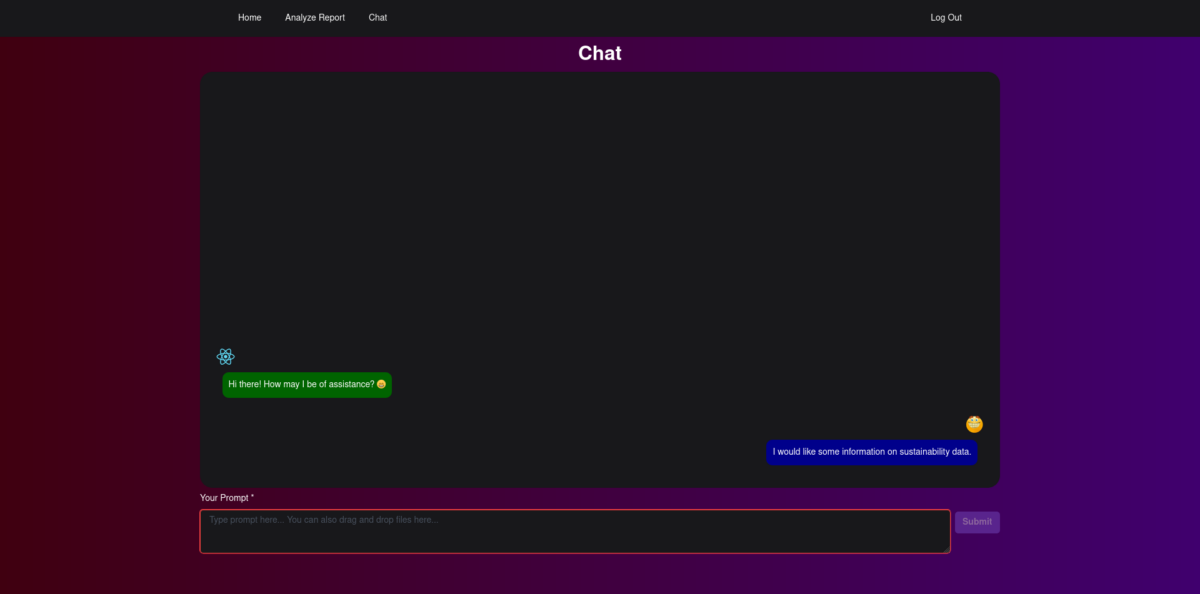
Figure 3: Chat section of the application
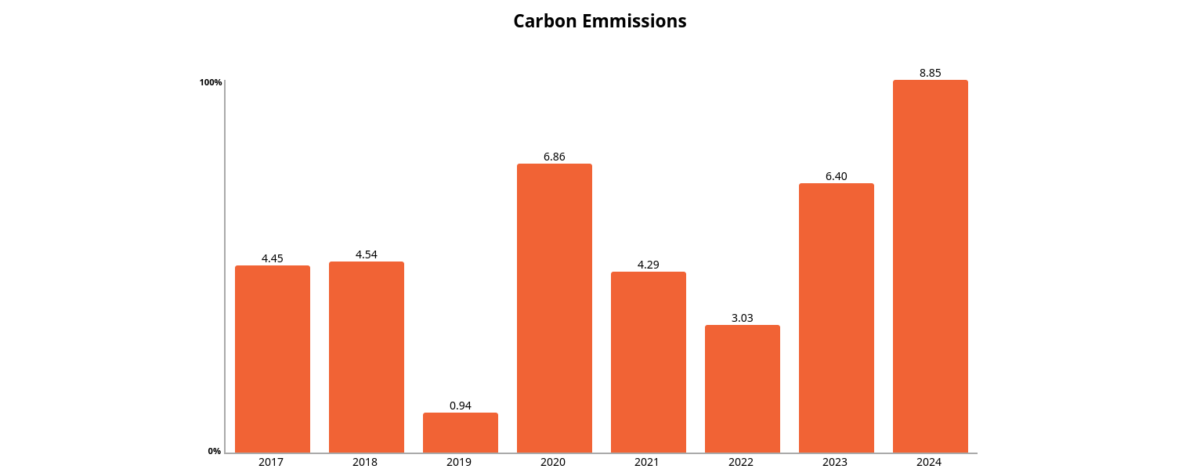
Figure 4: Analysis and Visualization
The Flow
Step 1
The user visits a website where the application is hosted. They then go to the data analysis page where they are presented with an interface to upload a sustainability report they would want to gather data from. Once uploaded they would submit the report for analysis. This would send the file to the server.
Step 2
At the server, the report is first converted into text format that can be used for further analysis. Then the text is fed into AI to get the key points from the data. Once we have the key points from the data, they are fed to an algorithm that can derive more insights from the data and package the resulting data in a JSON format that will be sent back to the user.
Step 3
The JSON is received by the web interface and is broken down into its constituent data points. If there are plots to be drawn from the data, it creates the corresponding plot objects and renders them to the user. The textual data is also rendered to the user on a per plot or per file basis.
Step 4
If the user is not satisfied with the results, they are presented with a chat interface where they can interact directly with the AI model to get it to produce results that are more in line with what the user wants. This presents a huge advantage where the tool can be used to assist the user as they see fitting rather than imposing a solution onto the user.
Benefits
- Customers may receive email notifications to pass information to them.
- Customers may submit feedback reports on the satisfaction level of the result received. This would then be fed back to the system to improve its response.
- Customers get value by getting their reports analyzed automatically and quickly.Cost of development of the system in terms of training of the AI and development of the Web UI.
- Customers also get a fast way to gather sustainability reports.
Limitations
- To provide more highly specialized results, fine-tuning of the LLM is required. This in turn will consume plenty of power depending on the quality of training data and desired results.