Challenge 4: Statistical data to promote Quality Education
¿How might we include digital strategies into the communities in order to bring the institutional data and the people closer together in the context of the education facility selection process?
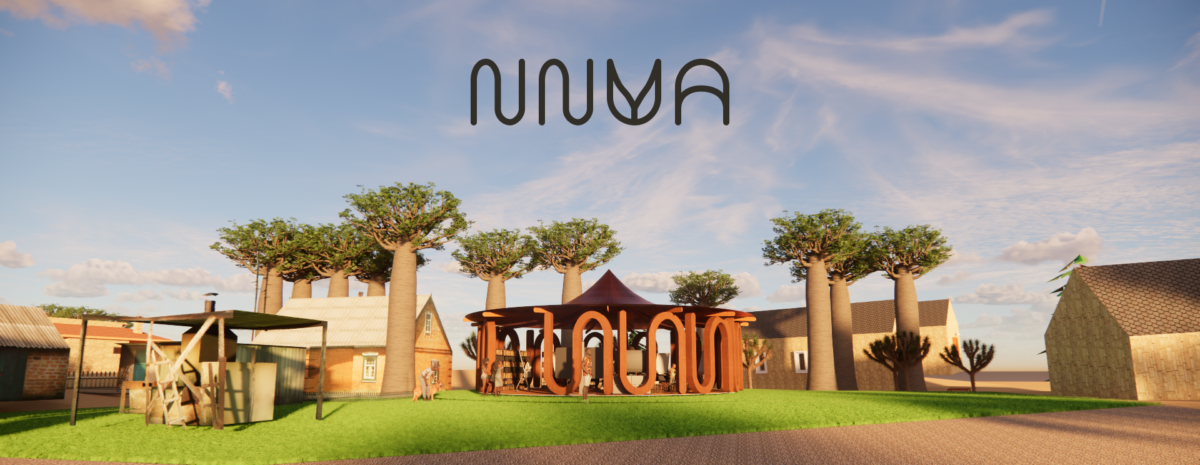
NNUA LEARN
NNUA, meaning “trees” in the Twi language, is born as a response to a problematic presented by Ghana’s Statistical Service, regarding access to quality education and aiding families in the process of selecting an educational facility for their children. This lack of support presents itself through many areas, listed bellow:
-There are large amounts of statistical data that go unused by the general public.
-Currently, the parents’ decision process for choosing an educational facility is unsupported and based on limited data.
-Little feedback process between community needs and institutions, which creates a breach between the provided information and the understanding of it by the people.
-There’s no platform in Ghana in which parents can compare schools and personalize their search.
-Lack of physical connection plus high rates of technological illiteracy.
How do we plan to solve it?
The NNUA LEARN proposal consists of digital and physical strategies that hope to bring the people and institutions closer together, helping emerging technologies reach currently isolated and disconnected communities all throughout Ghana’s territory.
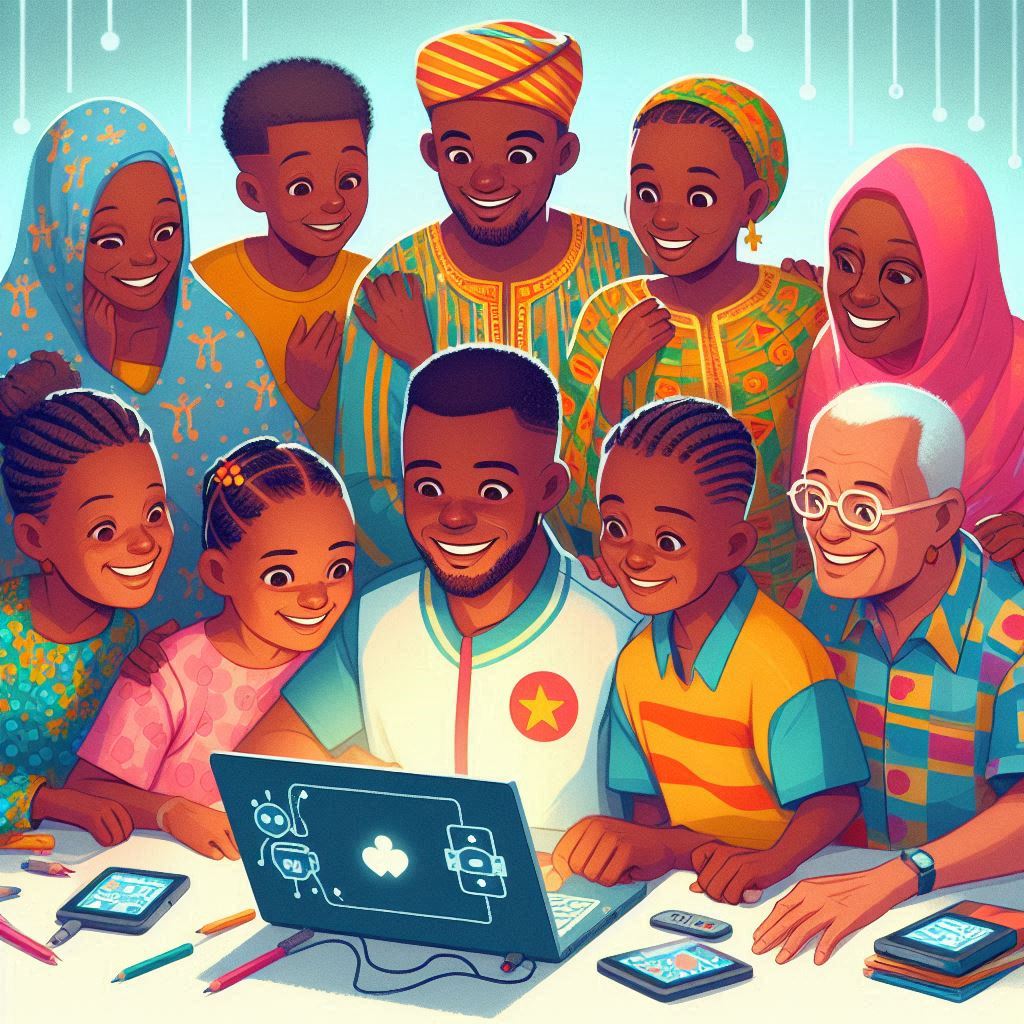
This visualization image was generated using Bing (Copilot)
Our first strategy is enclosed by a mobile application called NNUA APP. This interactive portal serves as a digital tool for presenting and personalizing the extensive schools database created using the information provided by the GSS. However, this interface goes beyond a consulting point where parents can see a lot of plain, unexplained data, and aims to actually get families to interact and actively participate in the decision process.
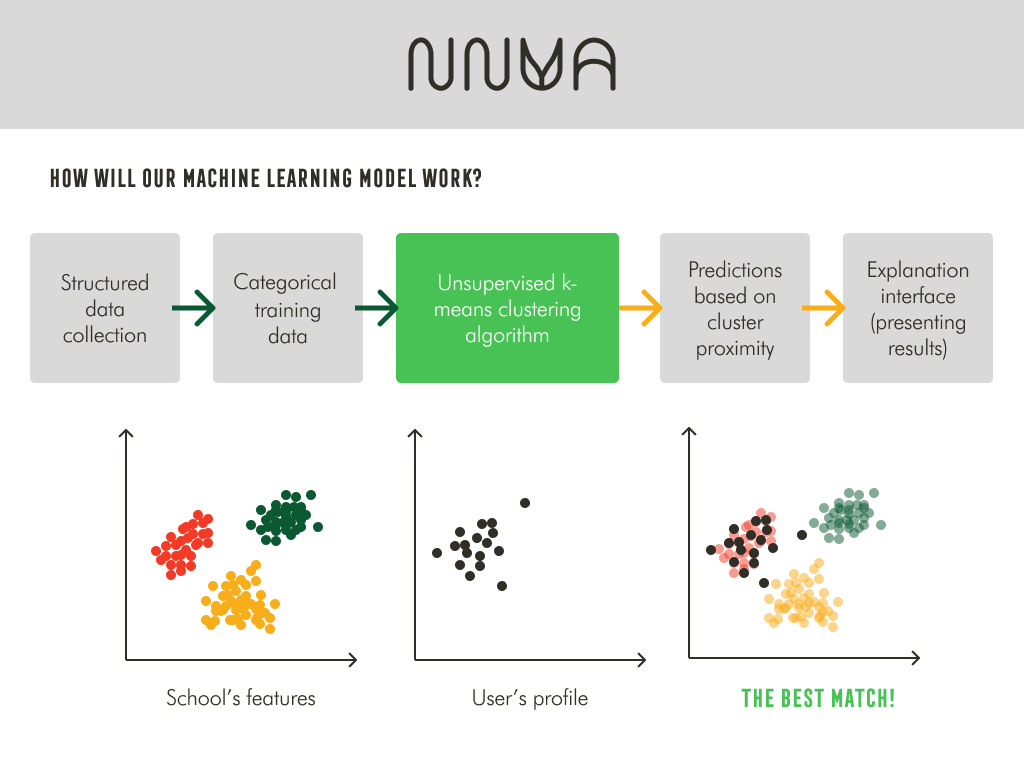
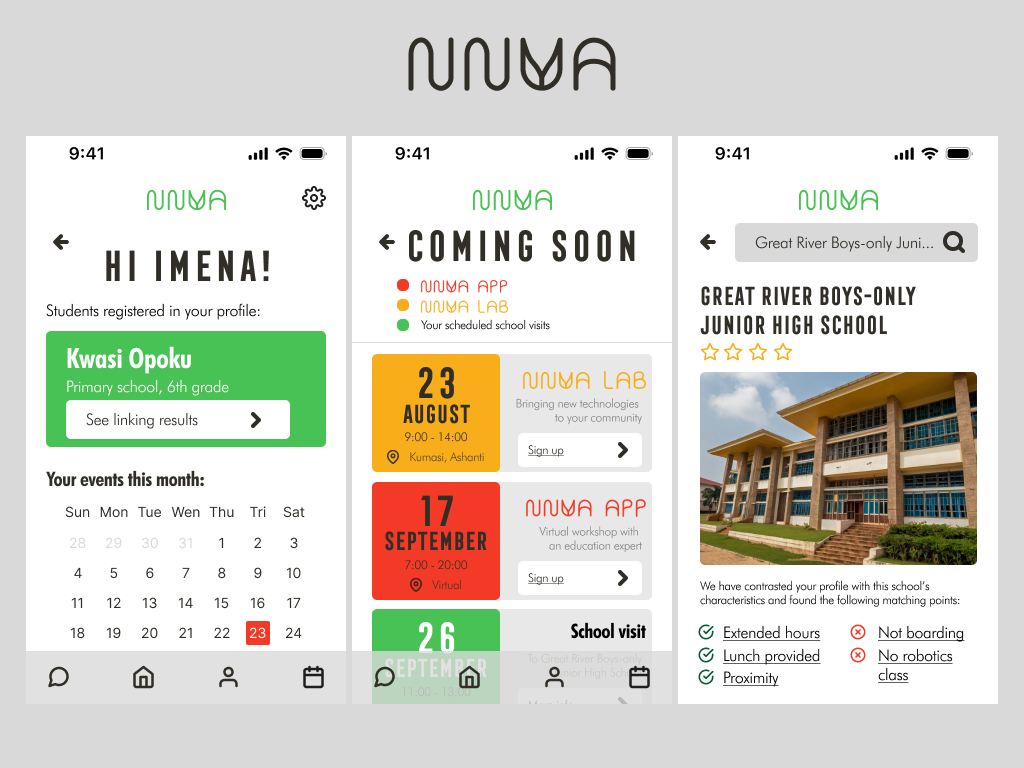
Our most powerful feature lies on our LINKING TEST, that, by using categories such as location, costs and career projections that fit the families conditions, allows users to specify their preferences, passions ans interests and, supported by a machine learning model, predict the institution that is best suited to their specific needs and wants. This is specially relevant because our purpose is to make the people feel involved and take charge of their own circumstances, understanding how we can deliver value to the biggest amount of people possible.
The great potential behind this strategy lies in its iterative nature, our whole proposal is based around cycles of school enrollment, that repeat every year. This means that, by formaing and maintaining a closed relationship with the users, it’s possible to perform user satisfaction surveys, in which the families would express their experience on the facility they chose and help tune the algorithm, by making the datapoint cluster more robust and distinct through a positive feedback loop of data collection.
And here’s how it looks like:
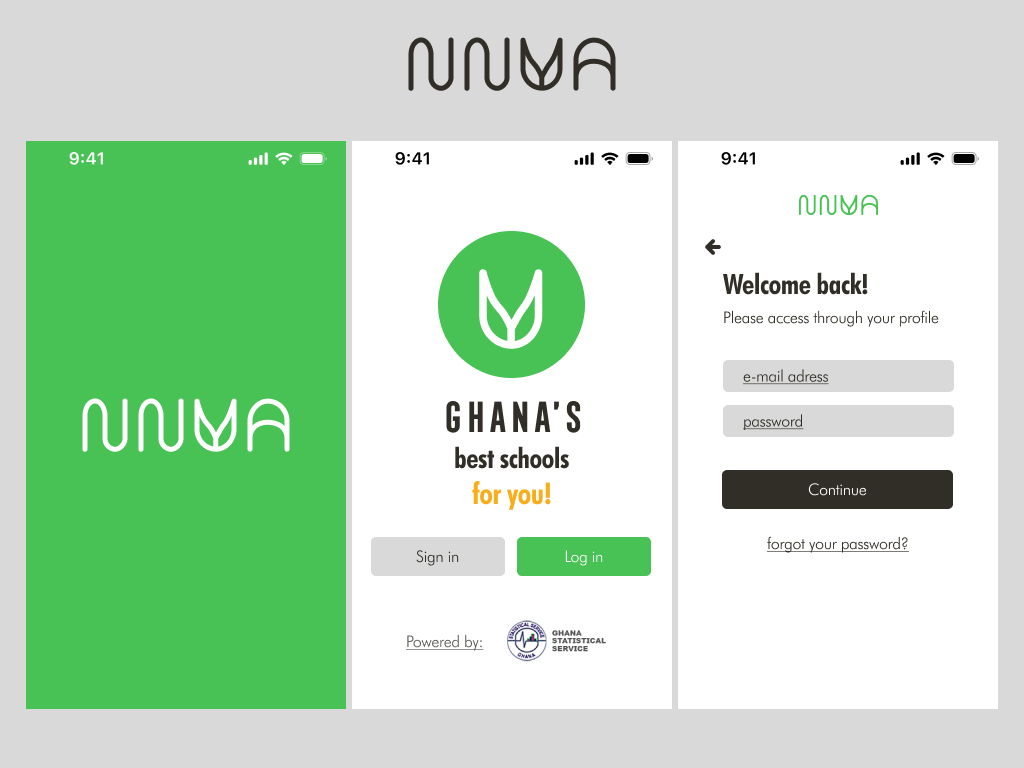
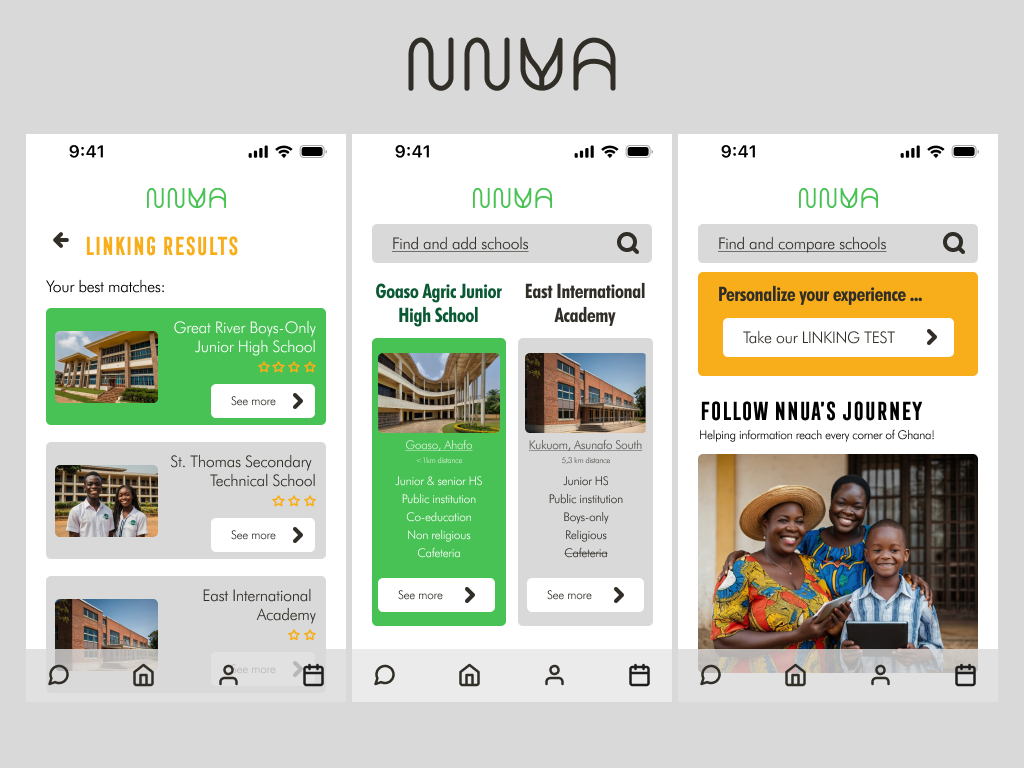
This is a preview of our app’s prototype, to navigate the interactive version, click here.
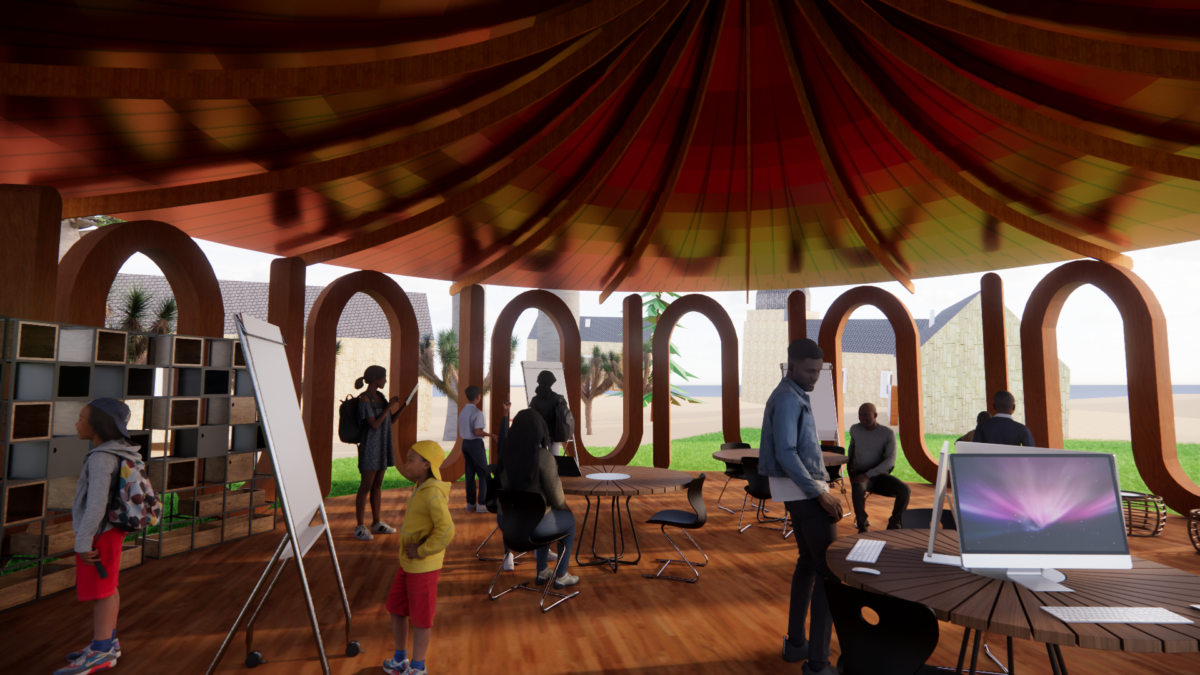
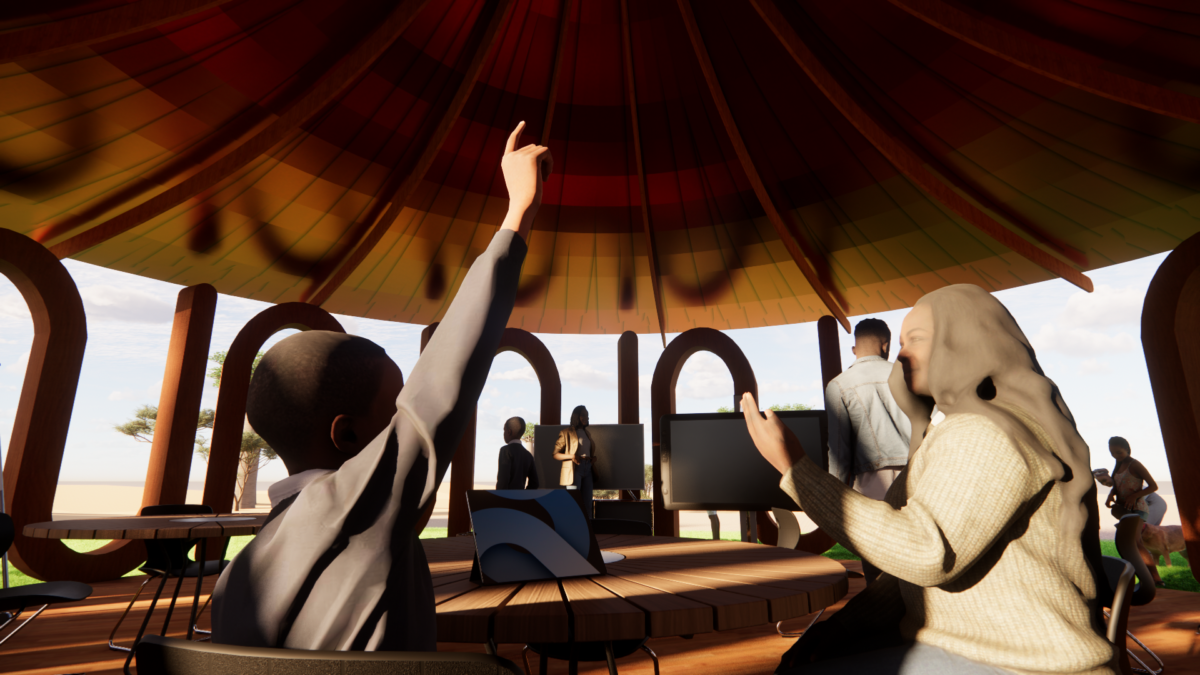
Seeking greater inclusion of rural communities, we offer complementary in-person support activities through the implementation of NNUA LAB, mobile laboratories that act as meeting centers, travelling across the country and gathering the communities to encourage participatory action and allow them to learn and interact with emerging technologies, reducing the digital gap and technological illiteracy through gamified community workshops that immerse them in the use of digital tools such as image creation software, video editing and AI chatbots.
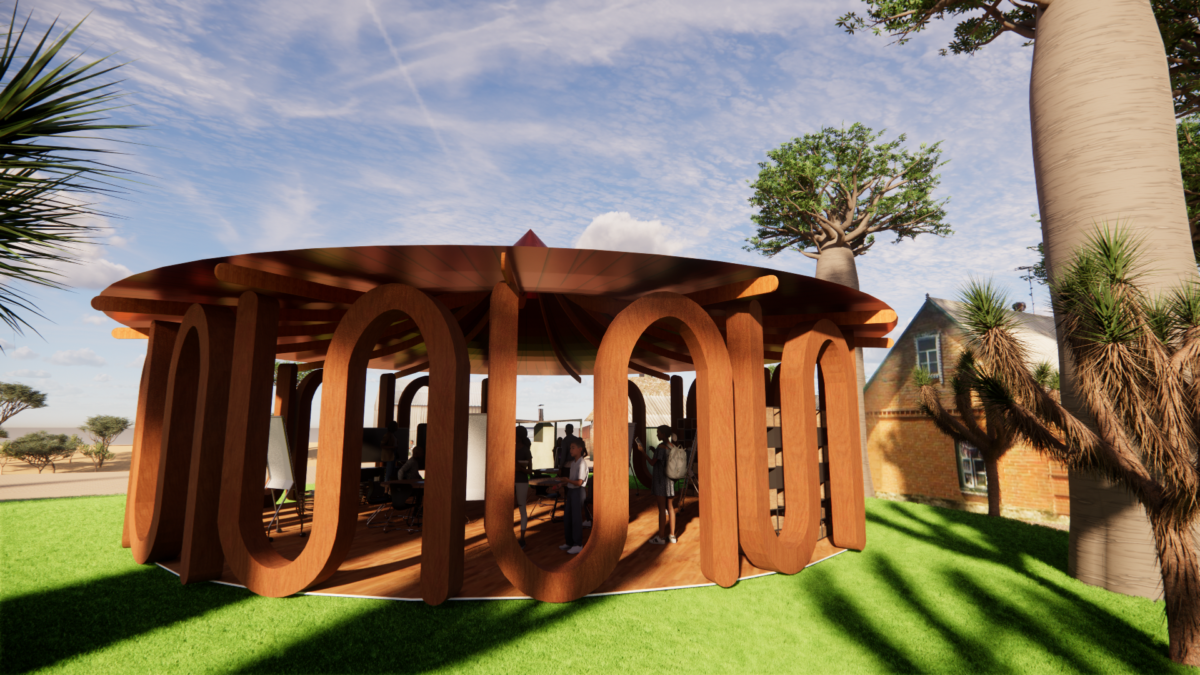
These workshops are planned around a full-week interaction with the community and the program consists of a variety of activities that allow for a long-lasting, deep connection between the digital stage and the physical plane. By participating in the proposed activities, we can collect and integrate personalized data into our iterative and auto-feedback Machine Learning model, thus, allowing for a more streamlined experience each time.
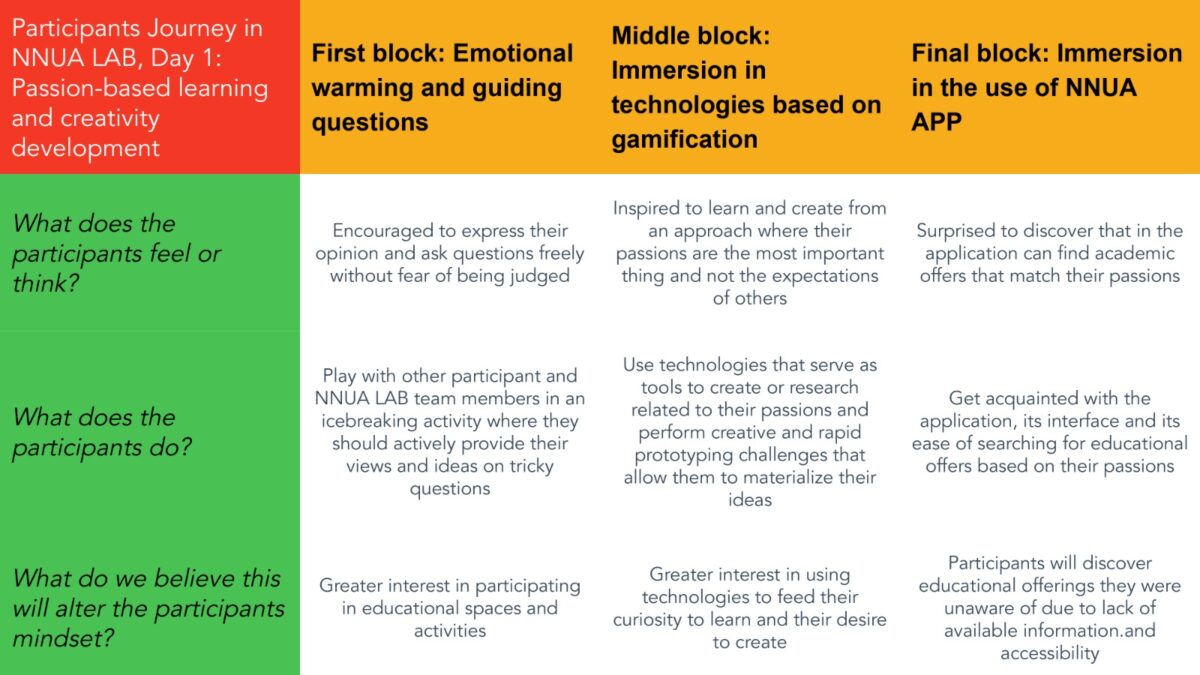
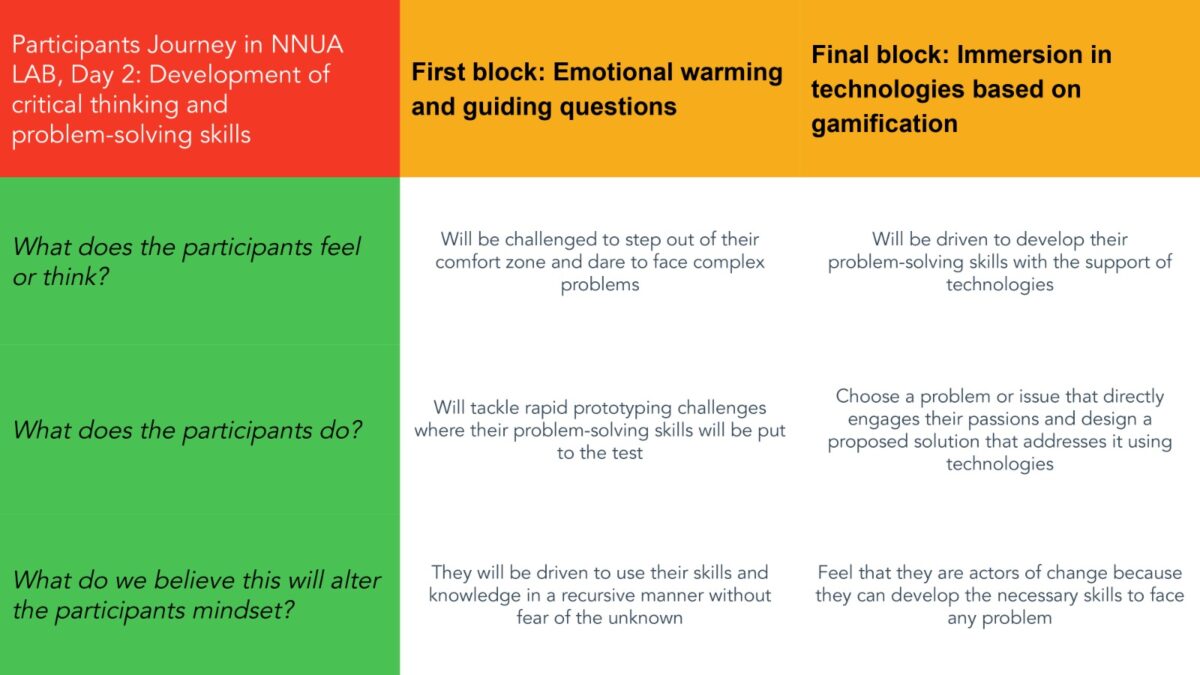
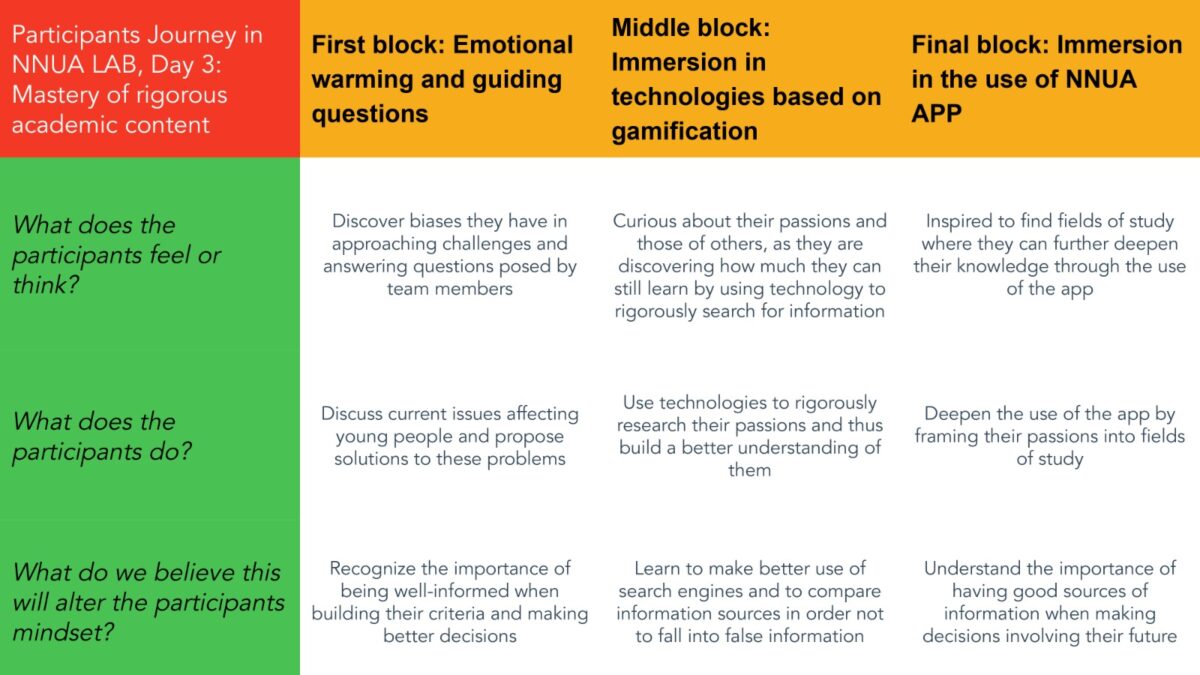
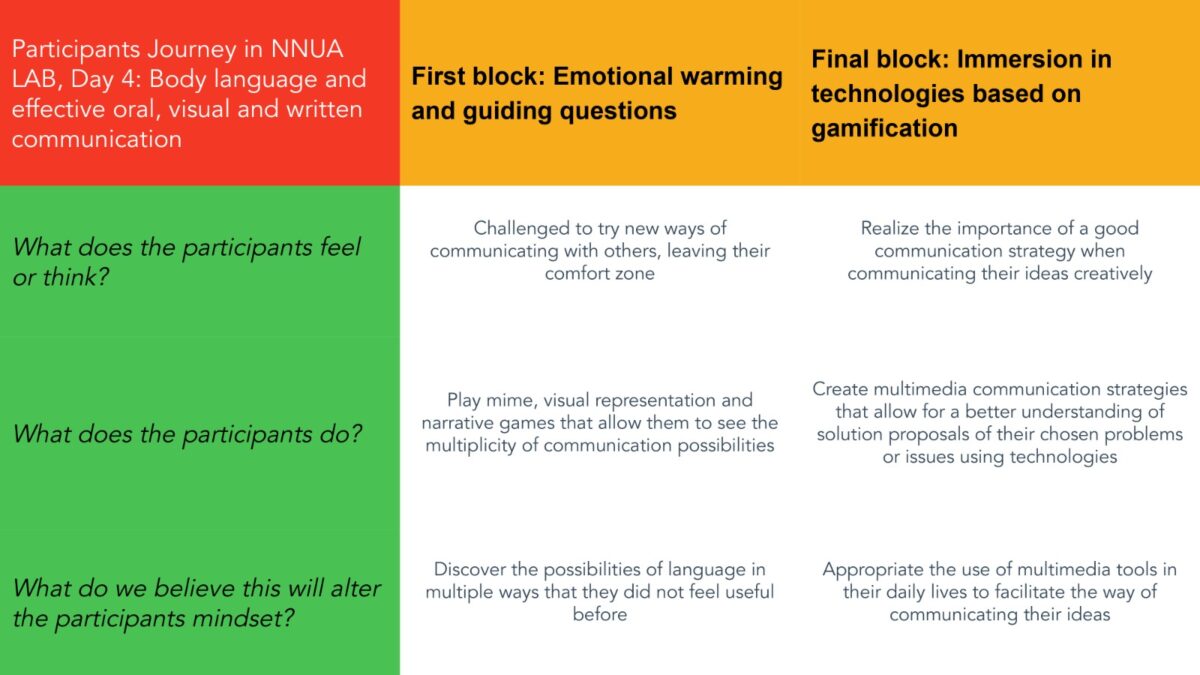
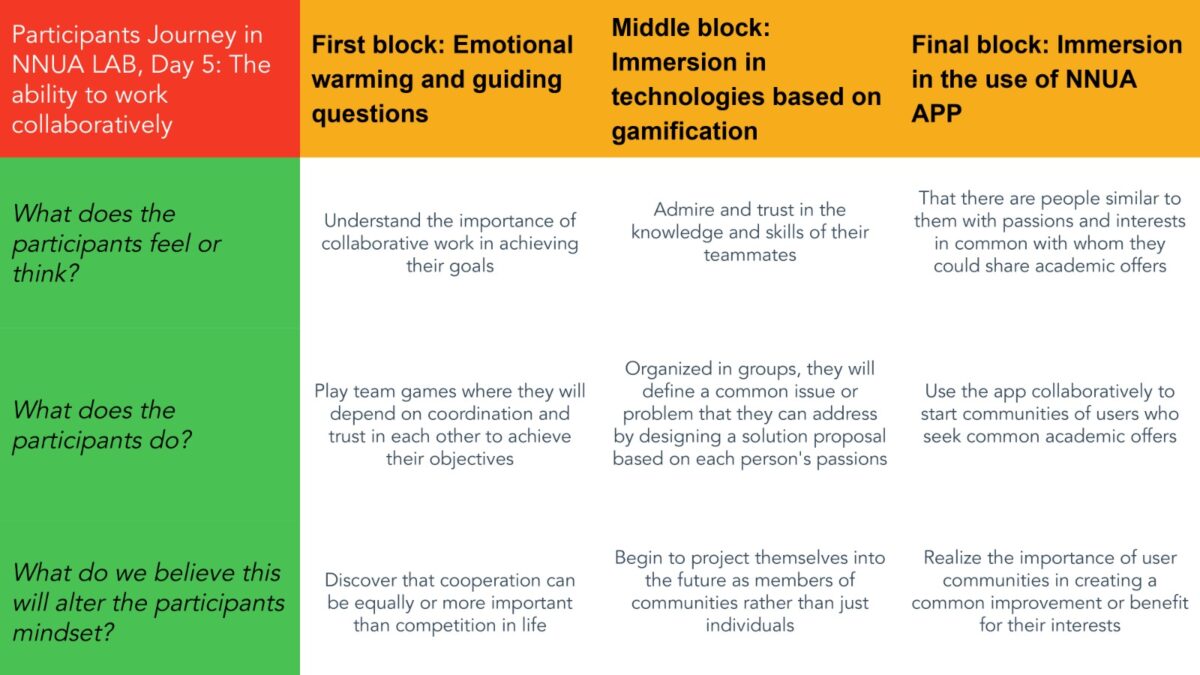
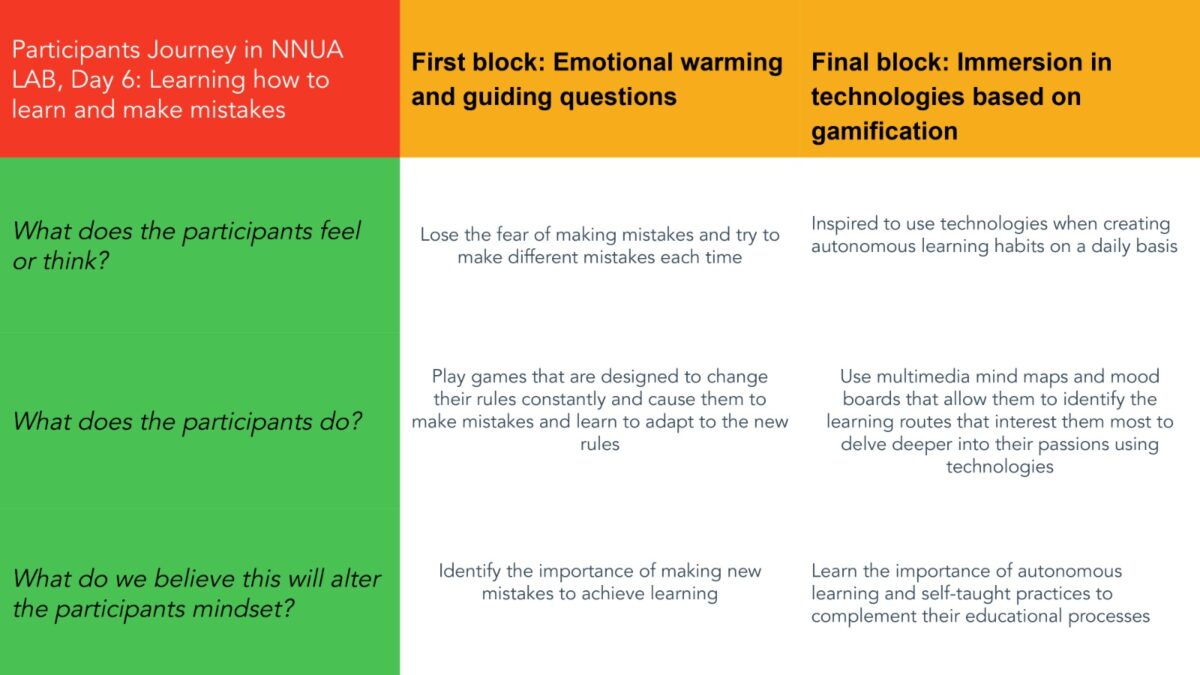
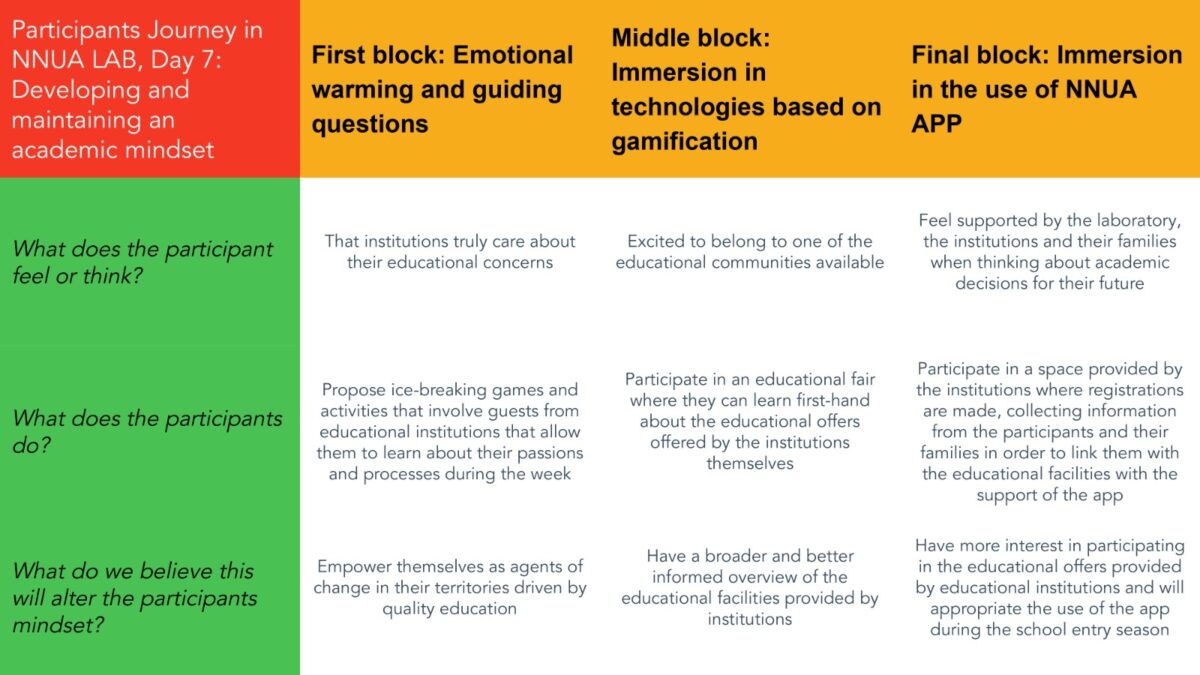
Taking the user experience into consideration, we present the following images of the proposed User journey maps for each workshop day:
DAY 1 (Opening day)
DAY 2
DAY 3
DAY 4
DAY 5
DAY 6
DAY 7 (Closing day)
The mobile laboratory consists of…