
Data-driven pastoral tracking and support system
Problem Statement: Enhancing Climate Resilience in Remote Communities Using Data and Technology
Due to extreme climate effects, pastoral communities have to stay on the move to search for water and pasture. They encounter challenges on the way and need help from DRC and other organizations to support them and allow them to thrive.
A Crucial Area We Needed to Explore
Currently, pastoral communities primarily use their phones (Nokia or Intel) to communicate their location to local authorities. However, it’s not guaranteed that they will always notify authorities when they move. As a result, authorities often lack precise knowledge of the pastoral group’s locations, which can sometimes even extend across borders, limiting their ability to provide effective assistance. This uncertainty presents a significant challenge, which we aimed to address by exploring ways to more reliably track the movement of pastoral communities.
Our Solution
Our solution is a digital system that helps pastoral communities, local authorities, DRC, and other important groups communicate better. It tracks the locations of pastoral communities and makes it easier for them to get help quickly if they face any problems all by the use of technology, data and data visualisation.
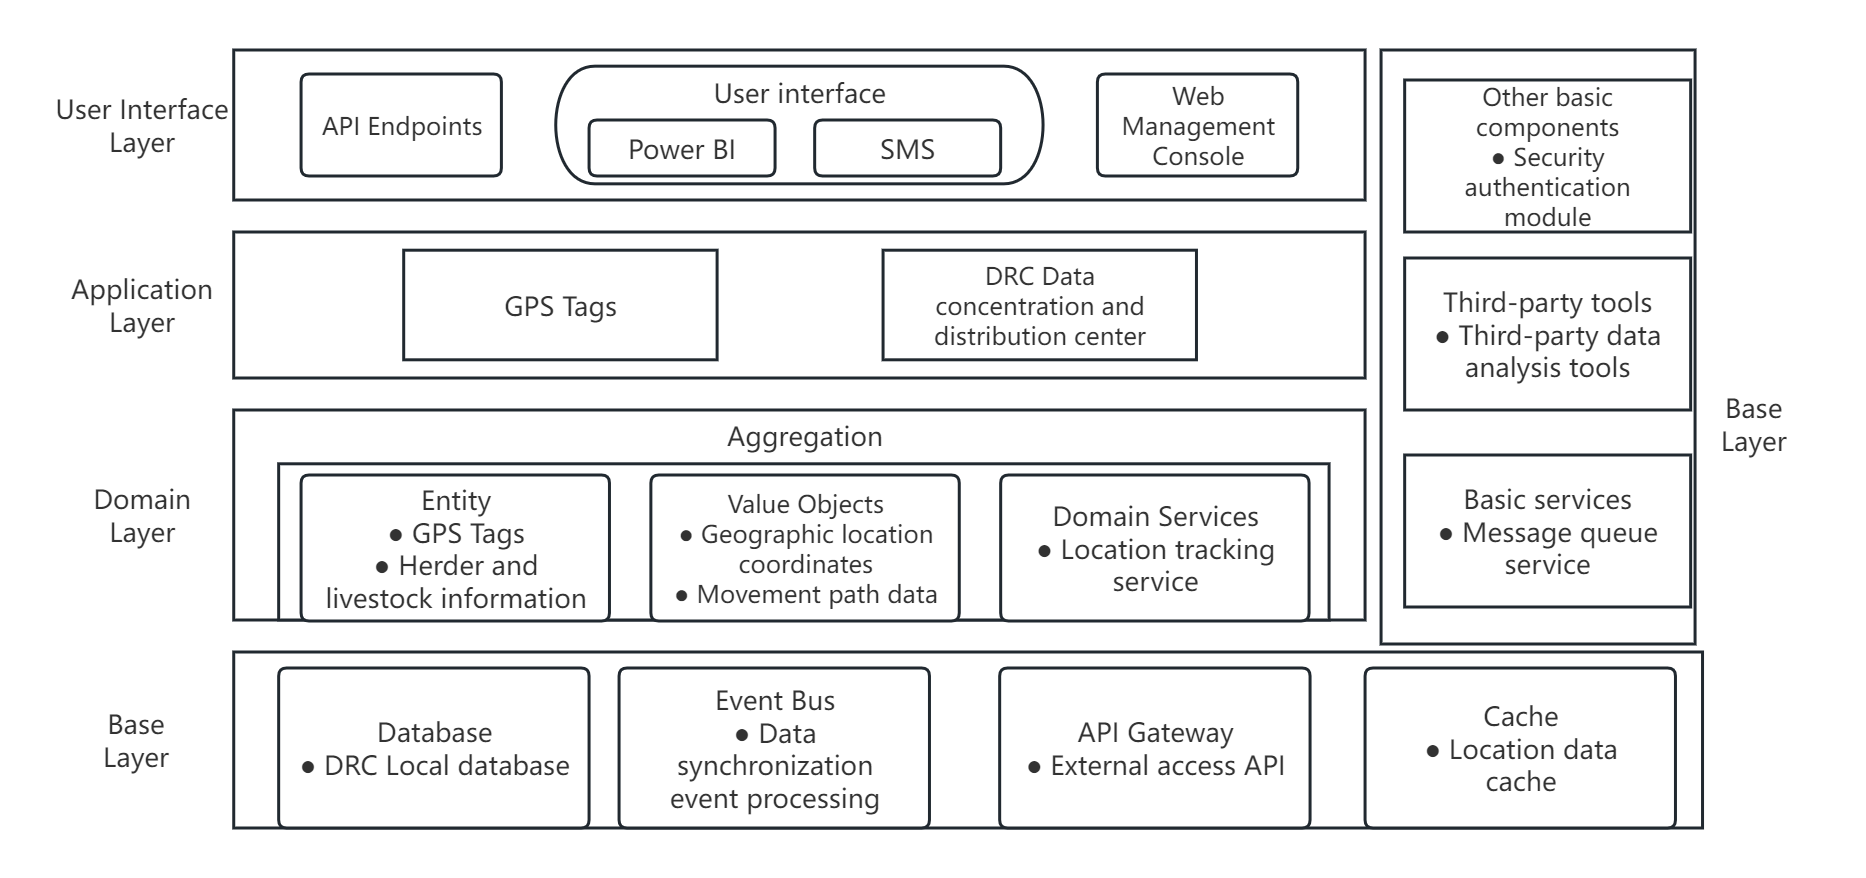
Fig 1: System architecture diagram
Method to Track Pastoral Communities and Use the Data:
GPS Tags can be used to track cattles position over long distances using a smartphone. Since local authorities have access to smartphoens, they are easily able to track the position of the pastoral communities. It can be charged by solar power and it costs only around 150 kroner in some countries e.g. China, and use solar as energy. Then the data can be fed into a data management platform e.g. SQL Server and Power BI.
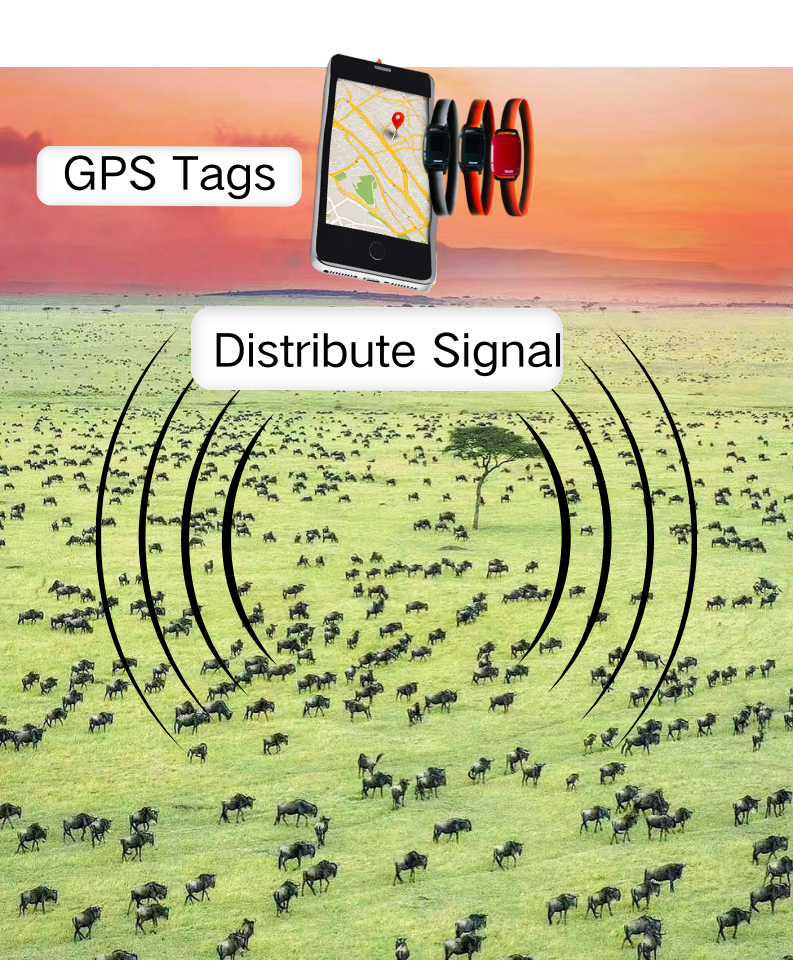
Fig 2: GPS Tags’ Using Example
Note: Currently DRC is using Sharepoint to store data related to activities that are held with pastoral communities, as seen in Fig. 1 below, and similar excel sheets could be made in Sharepoint to save the pastoral communities coordinates and location.
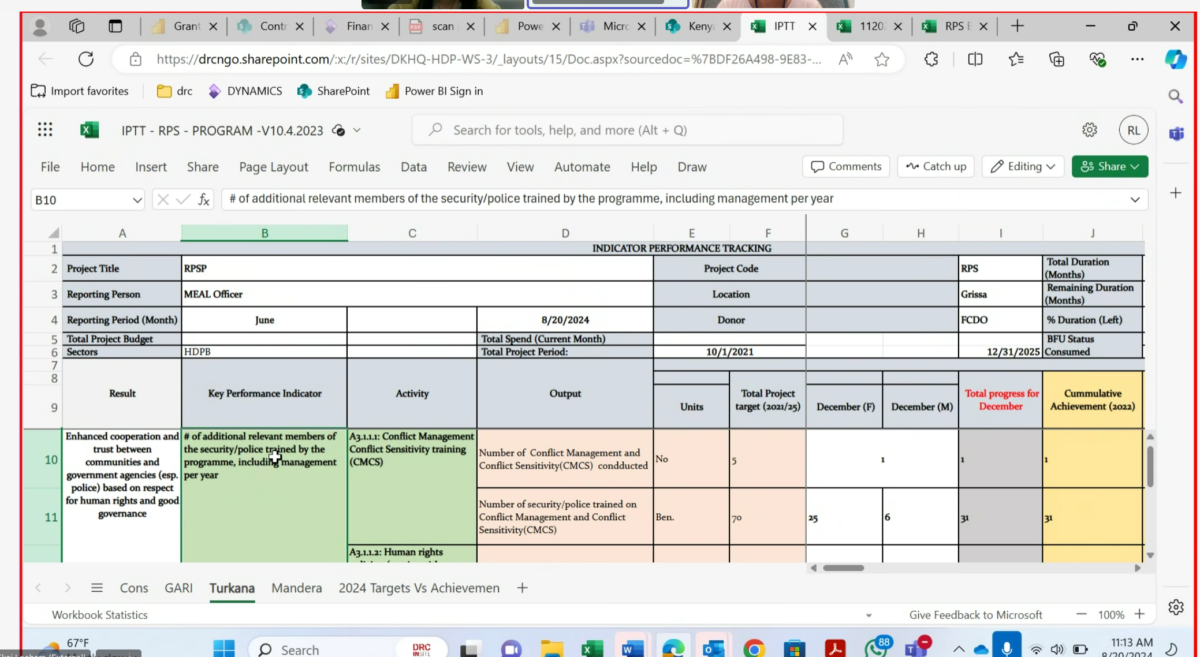
Fig 3: Its name
Than the data can be fed into PI Vision to visualise data in real time and Power BI to see the movement of pastoral communities over time. The PI Vision and Power BI dashboard can be created in advance by data scientists and data can just be fed into it afterwards. An illustration of this is in the Power BI dashboard in Fig. 2, where each circle could be one pastoral group:
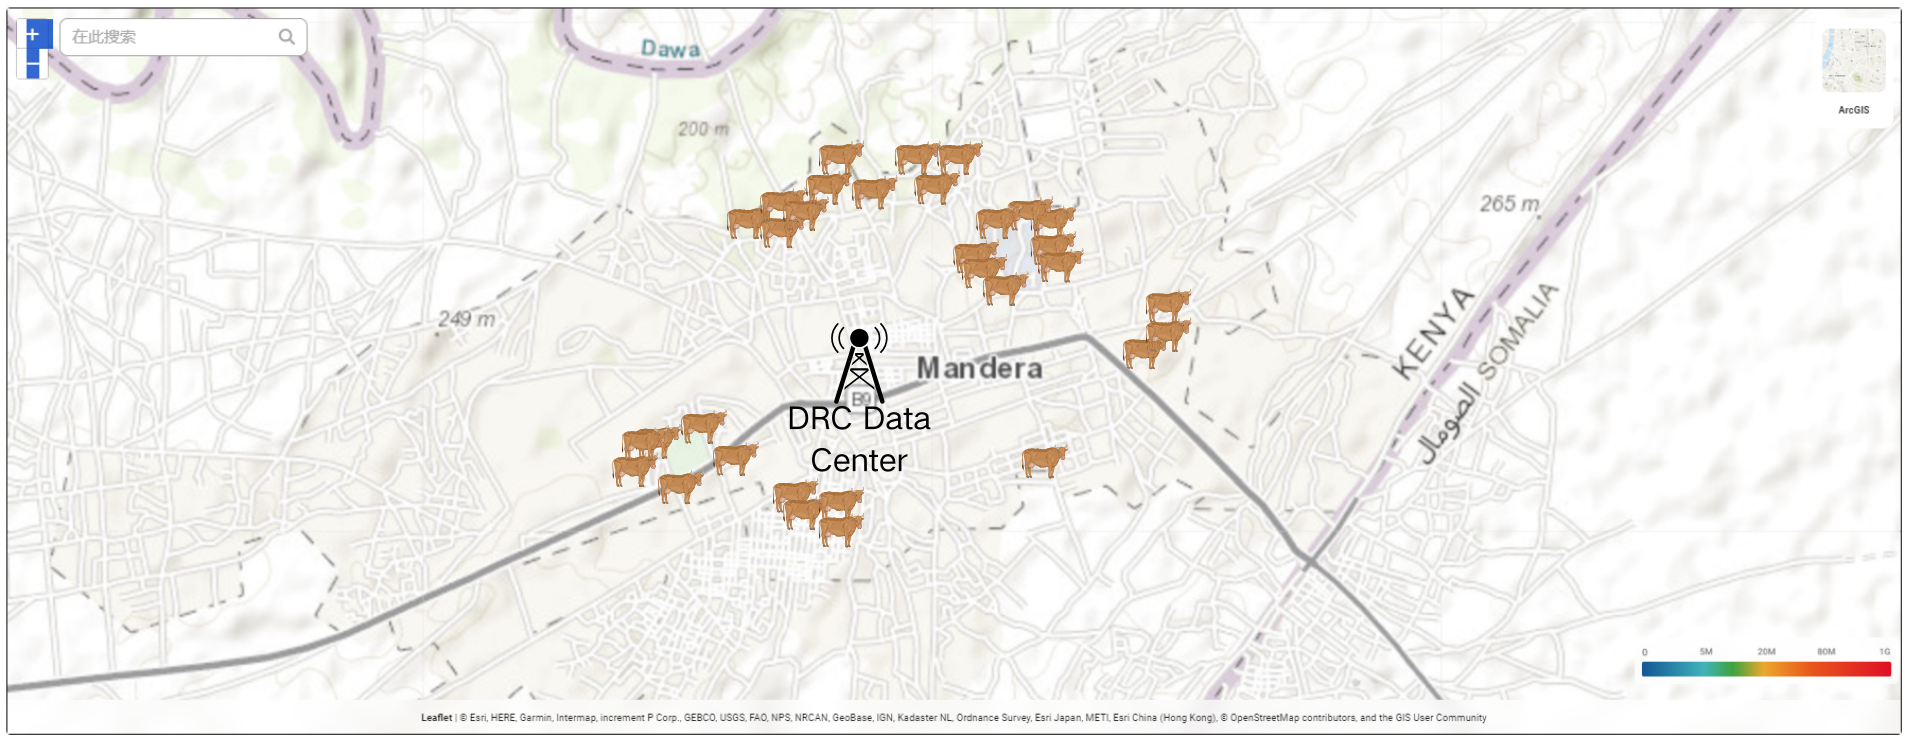
Fig 4: Mandera Cattle Map
Local Authorities have access to smartphones (unlike pastoral communities) and hence they can see the visualized data on their smartphones. Having these visualization tools makes it easier for local authorities to comprehend the data and provide assistance to pastoral communities.
It is powered by the electromagnetic energy transmitted from the RFID reader.
Method to Get Information on Water Sources Through Community Members:
We believe that gathering information directly from community members would be highly beneficial. When someone spots water or pasture, they can easily call or message DRC, which will automatically feed this data into Power BI and distribute it to relevant stakeholders, including pastoral communities.
Other Data That Can Be Used Better:
Weather forecasting is generally very accurate in Mandera County and areas surrounding it, hence we did not explore better ways for data creation but we did explore data utilization techniques involving data visualization. There are 2 main sources of weather data: ITK and PSP.
- ITK forecasts the weather through traditional methods involving animal observations, such as listening to bats and examining goat intestines.
- PSP, on the other hand, represents conventional weather data collection techniques.
When comparing both data sources, they generally align and provide accurate results.
This data can also be put in PI Vision and Power BI to give more information to local authorities to support pastoral communities in the weather-related challenges they face.
By utilizing tracking and data visualization tools, DRC and local authorities are better equipped to access and interpret crucial information, enabling them to more effectively support pastoral communities.
Citations:
Interview with Raphael Ekai Locham from DRC
https://science.howstuffworks.com/innovation/everyday-innovations/pet-microchip1.htm