Driving Global Sustainability Through Transparency: Unlocking the Power of Publicly Available Data
By Sabry Aboud, Asaad Msangi, Hellen Assey
Introduction
The future of business hinges on sustainability, but the road to meaningful impact is anything but straightforward. In today’s rapidly evolving business landscape, addressing sustainability challenges is more critical than ever. Yet, the path to meaningful solutions requires more than just isolated efforts; it demands strong partnerships across value chains. Unfortunately, a significant gap exists in the connection and integration of data across these chains, limiting the ability of companies to act on crucial insights.
Predicament
For any company looking to build a robust business case for sustainability, understanding its customers’ most pressing sustainability challenges is key.
As regulatory bodies and investors ramp up Sustainability Reporting requirements, companies are generating more publicly available data than ever before. However, the sheer volume of this data presents a daunting challenge. Gathering, processing, and analyzing it to extract actionable insights is a complex task, but one that holds immense potential. Solving this challenge could unlock unprecedented opportunities for advancing global sustainability practices.
So How do we Tackle this?
We now have an abundance of data at our disposal, question is how to we use to our advantage. That is where a team of three individuals from Tanzania have worked together to come up with a solution to this.
We have been developing a platform that collects all this data (ESG reports) and analyses it to find out the trends in material sustainability challenges of all companies in specific sectors. Where these insights can now be used by companies to craft Sustainability Value Propositions that resonate with market demand, bridging the gap between corporate strategy and customer expectations.
How does it work?
The platform will be accessible through a website, whereby stakeholders and researchers of various companies will be able to log in and view the trends and insights on specific sectors.
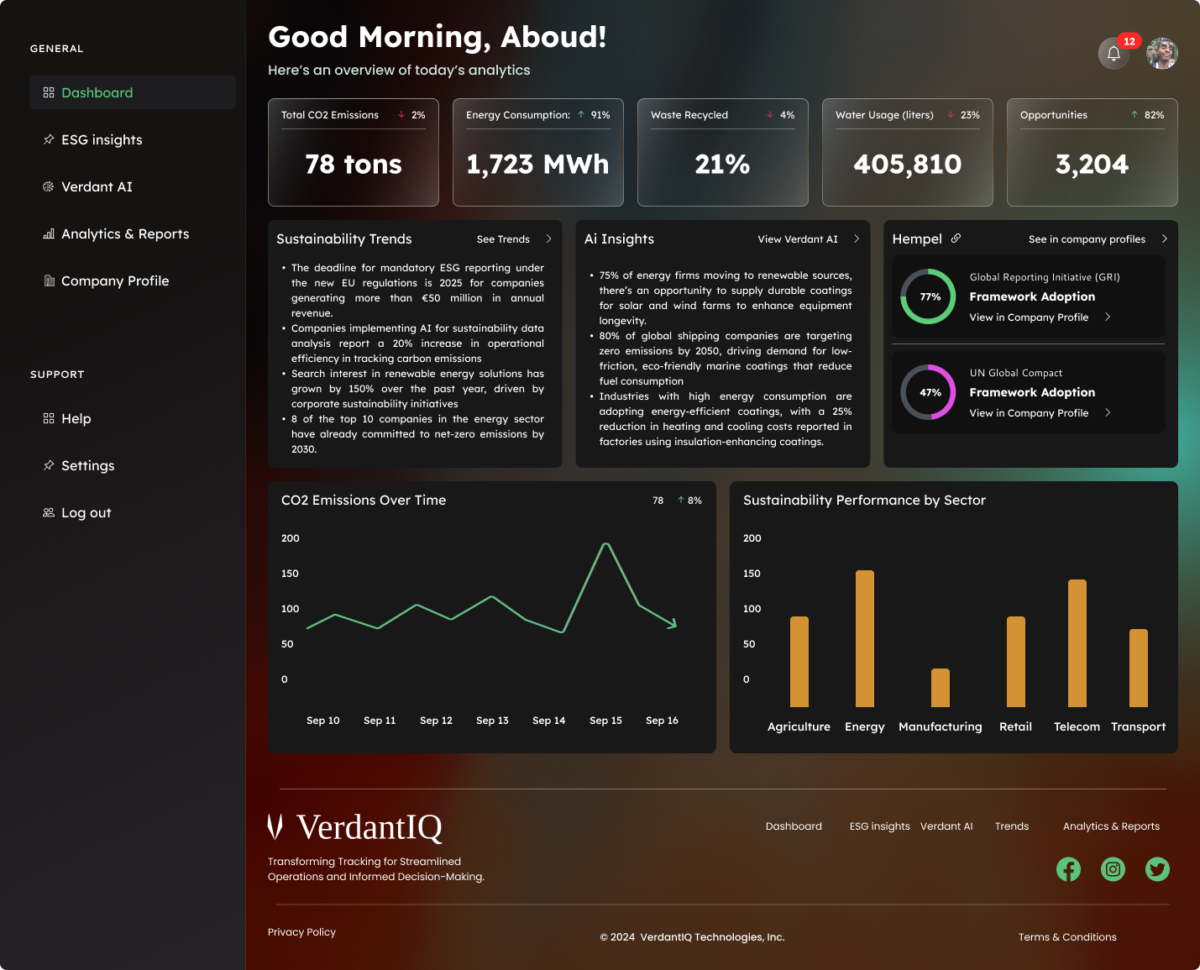
This platform will leverage web scraping technologies to gather the data from verified sources, NLP (Natural language processing) techniques for analyzing and graph analytics to provide the key insights into the material sustainability challenges of a specific sector lastly this data is presented in a way that both stakeholders and researchers can understand.
Technical Breakdown
1. Data Collection
This first step is crucial for our model since the wrong data will give you wrong results so first and foremost, we need to find a reliable source where we will obtain our data. In our case we choose the website sustainability-reports it is a reliable website that collects and categorizes reports by sector which will make it easy for us to web scrape. We choose a tool called Scrapy for our case but there is another tool called Beautiful Soup that could also be used.
2. Data Sorting And Storage
We need to store these PDFs somewhere in order to make the solution more optimal, instead of making it scrape the PDFs over and over again we can just request them from a database where we have categorized them into sectors. From here we will only initiate the scraping when a new report has been uploaded to the website. Now since there are a lot of reports, we are going to merge them and store them by sectors, thus all reports from the Agricultural sector will be merged and stored as one.
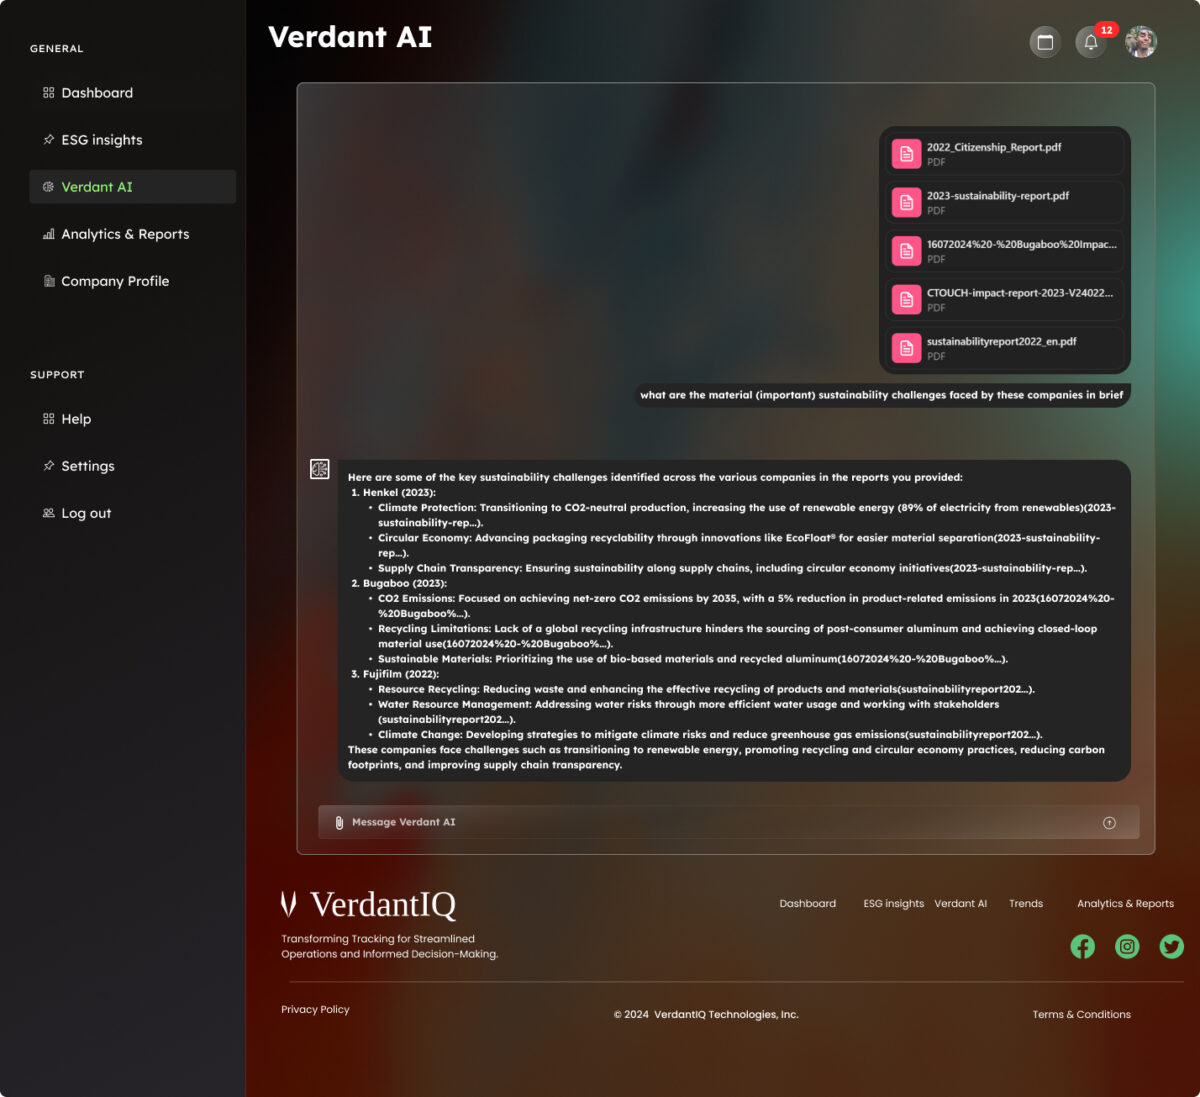
3. Data Analysis
This is where the fun begins, now there are a lot of ways to do this but with the research we have done it seems that using NLPs is the best way to go. We opted to use ChatGPT as our NLP since ChatGPT has a feature to create your own custom GPT to analyze the reports from our database and give us insights on the contents, so whatever we need be it trends on material (important) sustainability challenges and so on we just have to ask it.
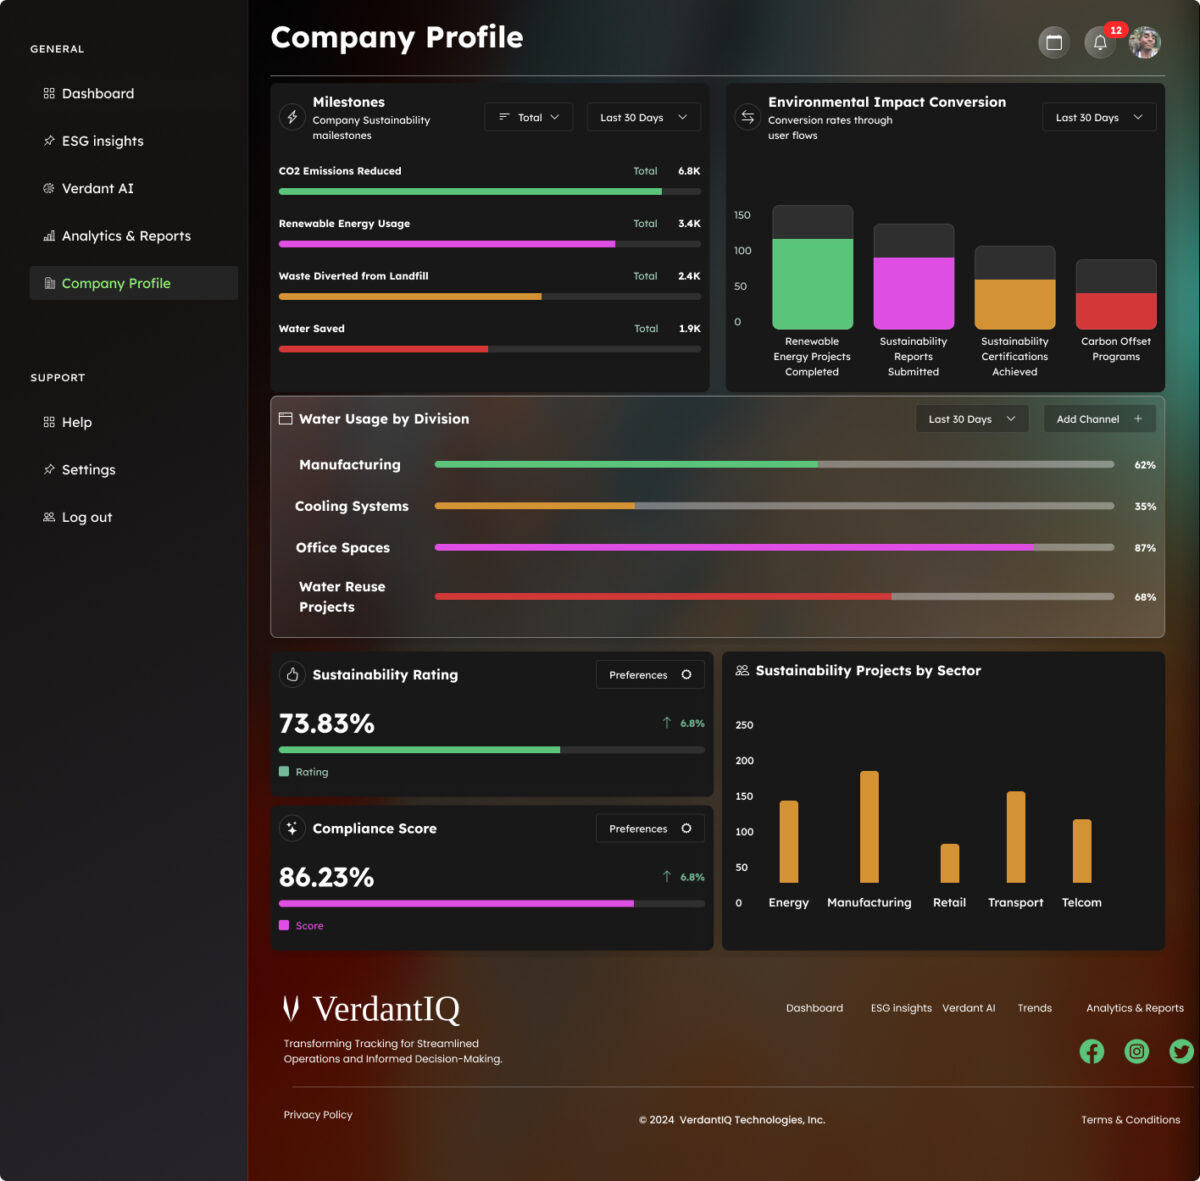
4. Data Visualization
Here we want the insights generated by our model to be visualized on our website. The model will save its responses onto the database thus we will visualize that data on our website through the database.
5. Automation
So in theory we have built our model and we are satisfied with the results. Now we want to automate this whole process well automating the entire process of analyzing sustainability reports, generating insights, and visualizing them on a website in the cloud involves several key steps. Here’s how you can achieve this:
1. Cloud Infrastructure Setup:
- Choose a Cloud Provider: Use platforms like AWS, Google Cloud Platform (GCP), or Microsoft Azure to host your entire pipeline.
- Provision Resources: Set up the necessary compute resources, such as virtual machines (EC2 instances on AWS, Compute Engine on GCP) or serverless functions (AWS Lambda, GCP Cloud Functions), to handle your processing tasks.
2. Automated Data Ingestion and Storage:
- Web Scraping Automation: Use services like AWS Lambda or GCP Cloud Functions to periodically run your web scraping code. Store the scraped PDF reports directly in cloud storage solutions like AWS S3 or GCP Cloud Storage.
- Database Setup: Use managed database services such as Amazon RDS, Google Cloud SQL, or MongoDB Atlas to store the reports and insights. Automate the ingestion of new data into the database using scheduled tasks (e.g., AWS Lambda triggers, Cloud Scheduler on GCP).
3. Automated Data Processing with Custom GPT:
- Model Deployment: Deploy your custom GPT model using a containerized environment (Docker) on services like AWS ECS, GCP Cloud Run, or Azure Kubernetes Service (AKS). Alternatively, use managed services like AWS SageMaker or GCP AI Platform.
- Automated Analysis: Set up a workflow using tools like AWS Step Functions or GCP Cloud Composer to automatically trigger the analysis of new reports as they are ingested into your system. The workflow should include extracting text from PDFs, feeding the data into the GPT model, and storing the generated insights back into the database.
4. Visualization and Front-End Hosting:
- API Deployment: Host your API on a cloud service (AWS API Gateway, GCP API Gateway) that interfaces with your database and serves data to your front-end.
- Front-End Hosting: Deploy your website on a platform like AWS Amplify, GCP Firebase Hosting, or Azure Static Web Apps. Ensure it dynamically fetches and displays the insights.
- Automated Front-End Updates: Use CI/CD pipelines (e.g., AWS CodePipeline, GitHub Actions) to automatically deploy updates to your front-end whenever changes are made to the underlying code.
5. Monitoring and Scaling:
- Monitoring: Implement monitoring tools (AWS CloudWatch, GCP Stackdriver) to keep track of the performance and health of your application.
- Auto-scaling: Configure auto-scaling policies on your compute resources to handle varying loads, ensuring that your application remains responsive during peak usage times.
6. Security and Access Control:
- Authentication: Implement secure authentication mechanisms using services like AWS Cognito, Firebase Authentication, or Azure Active Directory.
- Access Control: Restrict access to your APIs and databases using IAM roles and permissions, ensuring that only authorized users can interact with the system.
7. Automated Updates and Maintenance:
Database Backups and Maintenance: Automate backups and maintenance tasks using the cloud provider’s managed database services, ensuring data integrity and availability.
Regular Model Updates: Set up automation to regularly fine-tune or update your GPT model with new data, using services like AWS SageMaker Pipelines or GCP AI Platform Pipelines.
Here are some YouTube tutorials to guide you through the process
Conclusion
VerdantIQ is a powerful platform designed to help businesses unlock the full potential of their sustainability data. By offering real-time insights, AI-driven analysis, and seamless data integration, VerdantIQ empowers companies to make informed, sustainable decisions that align with both regulatory requirements and market expectations. As sustainability becomes increasingly central to business success, VerdantIQ provides the tools necessary for companies to not only meet compliance standards but also to drive meaningful environmental and social impact. With VerdantIQ, sustainability becomes more than just a goal it becomes a strategic advantage.